SUN NOISE: The sun produces a high level of noise in the electromagnetic spectrum due to a multitude of processes, such as the acceleration of electrons and ions in the intense magnetic fields that are present in the sun, ejection of ions and electrons from turbulent regions, charges spiraling around magnetic field lines, combining of oppositely charged particles to form molecules, and other radiative processes. A portion of the radiation emitted by the sun is in the microwave frequency range and can be used to good advantage by EME operators as a convenient high-level noise source to check their system performance routinely and/or to compare their system performance with other EME stations that have also made sun noise measurements.
WHY NOT USE COSMIC RADIO SOURCES INSTEAD?: While it is true that many cosmic radio sources provide stable radio emissions in the microwave range and such sources can be used extremely reliably for performance checks by stations that have reasonably high performance, many amateur radio EME stations do not have receive performance high enough to utilize such sources conveniently. It is our desire to investigate the use of the strongest signal source in our sky, namely our sun, as a means to monitor system performance. Any EME station that is operational can easily measure sun noise with a reasonably high signal to noise ratio. The challenge in using sun noise as a calibration source is in developing a protocol that adequately accounts for the varying solar flux from the sun.
SUN NOISE STUDY: During the period July 2005 through September 2006 Joe, K5SO, and Frank, W2UHI, performed a collaborative study of sun noise in order to develop a generic protocol for sun noise measurements by which amateur radio EME stations can monitor their receive system performance routinely and that can be used to objectively compare the receive system performance of individual EME stations, regardless of their specific system configurations. A summary of the results of the study appear on this page. The study, in part, involved determining a physics-based analytical expression for the expected sun noise that will be measured by any given EME station after an initial calibration point is measured by the station. The explanation below illustrates how one can use the expression in concert with solar flux measurements made by solar observatories to predict sun noise values that will be observed by the EME station under any given solar flux condition.
USING SUN NOISE

EXPLANATION OF GRAPH:
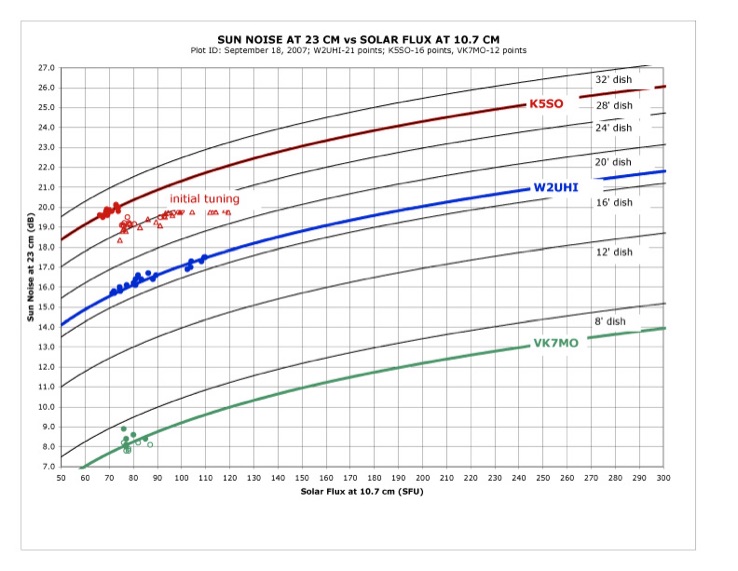
The BLACK curves are predictions for sun noise using dish antennas of various diameters, as labeled, assuming that the system using the dish has system performance that is equal to that of the K5SO system in all respects other than that attributable to dish diameter. Note that the BLACK curves ARE NOT an absolute prediction of what anyone should see using the indicated dish size! Individual stations may see more sun noise or may see less sun noise than the BLACK curves predict, depending upon how the individual station receive system performance compares to that of the K5SO receive system corrected for dish size. Stated alternatively, the BLACK CURVES represent the amount of sun noise that K5SO should see if the 28' dish at K5SO were replaced by a different size dish. The reader should note that the functional form of the sun noise curve (i.e., 23 cm sun noise as a fuction of the 10.7 cm solar flux) for an individual station is properly given by the expression shown in Eqn. (1) below. The actual measured points collected by an individual station will determine what value of A should be used in Eqn. (1) for the particular station. Once A is determined (either by a single sun noise measurement or by a non-linear least squares fit of multiple measurements of sun noise), Eqn. (1) will predict the amount of sun noise that will be observed by that station at 23 cm wavelength under an arbitrary 10.7 cm solar flux condition, within the limits constrained by the accuracy to which the value A has been determined.
The solid RED, BLUE, and GREEN curves are plots of the function:
SN = 10 * log(((0.72*(SF-64))+47)/A) (1)
where SN is Sun Noise measured in dB above that measured for cold sky at 23 cm, SF is the 10.7 cm Solar Flux number (measured by the Dominion Radio Astrophysical Observatory (DRAO) in Pencticton, BC, Canada) that was valid at the time the 23 cm Sun Noise measurement was made, A is a constant that is determined by a non-linear least squares fit to the measured points, and log refers to the common (base 10) logarithm. Solar Flux measurements by DRAO at 1700Z, 2000Z, and 2300Z (seasonal schedule) are automatically posted a few minutes after they are made at: http://www.spaceweather.gc.ca/sx-4-eng.php. The exact form of Eqn. (1) is based upon an extension by us of concepts contained in "Antenna Calibration Using The 10.7cm Solar Flux (PDF, 4.7MB download) " by Dr. Ken Tapping of DRAO.
The solid RED curve is a plot of Eqn. (1) in which A was determined from a least squares fit to 16 measurements of Sun Noise at K5SO (28’ dish, VE4MA-style feedhorn). The fit yields A=0.5381125 and 1-sigma SN variance = 0.11 dB. The RED OPEN SYMBOLS represent earlier measurements of sun noise by K5SO in which the feedhorns were apparently not tuned quite optimally. The red open triangle data were collected using a square septum feedhorn with circular scalar ring and the red open circle data were collected using a VE4MA-style feedhorn before the impedance of the RX/TX probe connectors on the horn were optimized. In the solid red circle symbol data, the impedance of the RX connector on the VE4MA-style feedhorn was adjusted by reducing the diameter of the RX monopole probe by 0.020" from the original 0.125" diameter only along the portion of the probe that lies inside the connector housing proper, i.e., without changing the 0.125" diameter or 2.004" length of the portion of the probe that lies beyond the connector housing and that extends into the horn waveguide interior and also without changing the 0.250" inside diameter dimension of the connector housing through which the probe conductor passes. Only the diameter of the portion of the center conductor passing through the connector housing was changed. In the case of the RX probe, return-loss measurements at the RX connector were 20 dB before the connector was modified and 35 dB after it was modified. Similar modifications on the TX port yielded 20 dB return loss before modification and 28 dB after modification. The substantial increase in return loss at the receive connector at the horn resulted in a substantial improvement in receive sensitivity performance for the station; in fact, the modification resulted in nearly a 1 dB improvement in effective sensitivity, as can be immediately seen by the relative positions of the red solid symbol data and red open symbol data on the chart. After the connector modifications were made, self-sent echoes from the moon by K5SO were increased from a previous average relative S7 level to S8, almost 3 dB! In summary, the differences between the red open symbol data and the red solid symbol data on the chart serve as an illustration and a practical example of the utility of sun noise prediction charts like this one in using systematic sun noise measurements to straightforwardly analyze and compare the receive performance of EME stations over time and after equipment modifications. It is precisely this practical utility that we had hoped to be able to demonstrate with the results of our sun noise study.
The solid BLUE curve is a plot of Eqn. (1) in which A was determined from a least squares fit to 21 measurements of Sun Noise at W2UHI (18’ dish, VE4MA-style feedhorn). The fit yields A=1.434519 and 1-sigma SN variance = 0.12 dB.
The solid GREEN curve is a plot of Eqn. (1) in which A was determined from a least squares fit to 12 measurements of Sun Noise at VK7MO (7.5' dish, square waveguide septum feedhorn). The fit yields A=8.758392 and 1-sigma SN variance = 0.22 dB.
K5SO thanks W2UHI and VK7MO for making their results available for the study.
